Recently I saw a Twitter thread bemoaning the rise of ‘psychological safety’ as a phrase. Not because it isn’t important – it is – but because giving it a name has made it acceptable and risks giving a scapegoat to hide behind. There’s the possibility that just saying ‘My organisation / team doesn’t promote psychological safety’ makes it OK.
I have similar feelings about ‘Technical debt’. As a phrase in its original sense (the fact that not keeping code clean and deployable eventually incurs a real, financial debt that must be repaid), it is useful. But every non-startup I have heard of has struggled with ‘technical debt’ and it has started to be accepted as just something that happens.
Let’s not forgot that not all technical debt is bad. There can be good reasons for taking on debt, and in fact I’d actively encourage it in embryonic, experimental projects, provided it is monitored and quickly repaid.
But with excessive debt, a time comes when development teams become so crippled by the legacy code that progress slows to a snail’s-pace and further work becomes unacceptably risky. In these situations, where should you start with ‘debt reduction’? I’ve seen projects that have quickly spiralled out of control into a whole rewrite project, or worse the team can become embroiled in a long discussion about the best way to fix things.
One of the teams I work with was in such a state last year. In fact, it was worse than that. They actively did not know which products they had on live servers (these are all websites) and there were so many inter-dependencies between them that it was almost impossible to know where to start.
Fortunately, our boss understood the problem and was willing to give some time to sort it out. Together with the Product Manager and our Site Reliability Engineering team, I helped to set some goals for the team to start tackling the issue, without ending up rewriting everything. Our definition of what good looked like was:
- No websites should be running on unsupported operating systems
- All sites should be deployed through our CI pipeline
- All code should be deployable at any time
- Nothing should be deployed with a CVSS score greater than seven (still high, but a reasonable, measurable start)
(This may sound unambitious, but based on where we were starting from, it was a big challenge!)
The team then set about fixing up the most obvious candidate products.
We soon hit our biggest issue. With the team struggling to untangle the code – often written by contractors, and so completely unknown to the team – progress towards these goals was slow. It was also almost impossible to report on. Furthermore, because we didn’t even have a full list of products or which servers they were on, any measure of progress towards an end-point (such as burndown / burnup) would be meaningless.
In SMART terms, we didn’t know whether our goals were achievable or realistic, and so we also couldn’t timebox them, which was unacceptable. It was clear we needed a way to measure and to report on the beast. This was not just for management. Part of our thinking was also that measurement would help morale in the team. Although at this early stage, they were pleased to have the opportunity to work on something that had been a pain for years, but it was clear that this would not last without regular celebration.
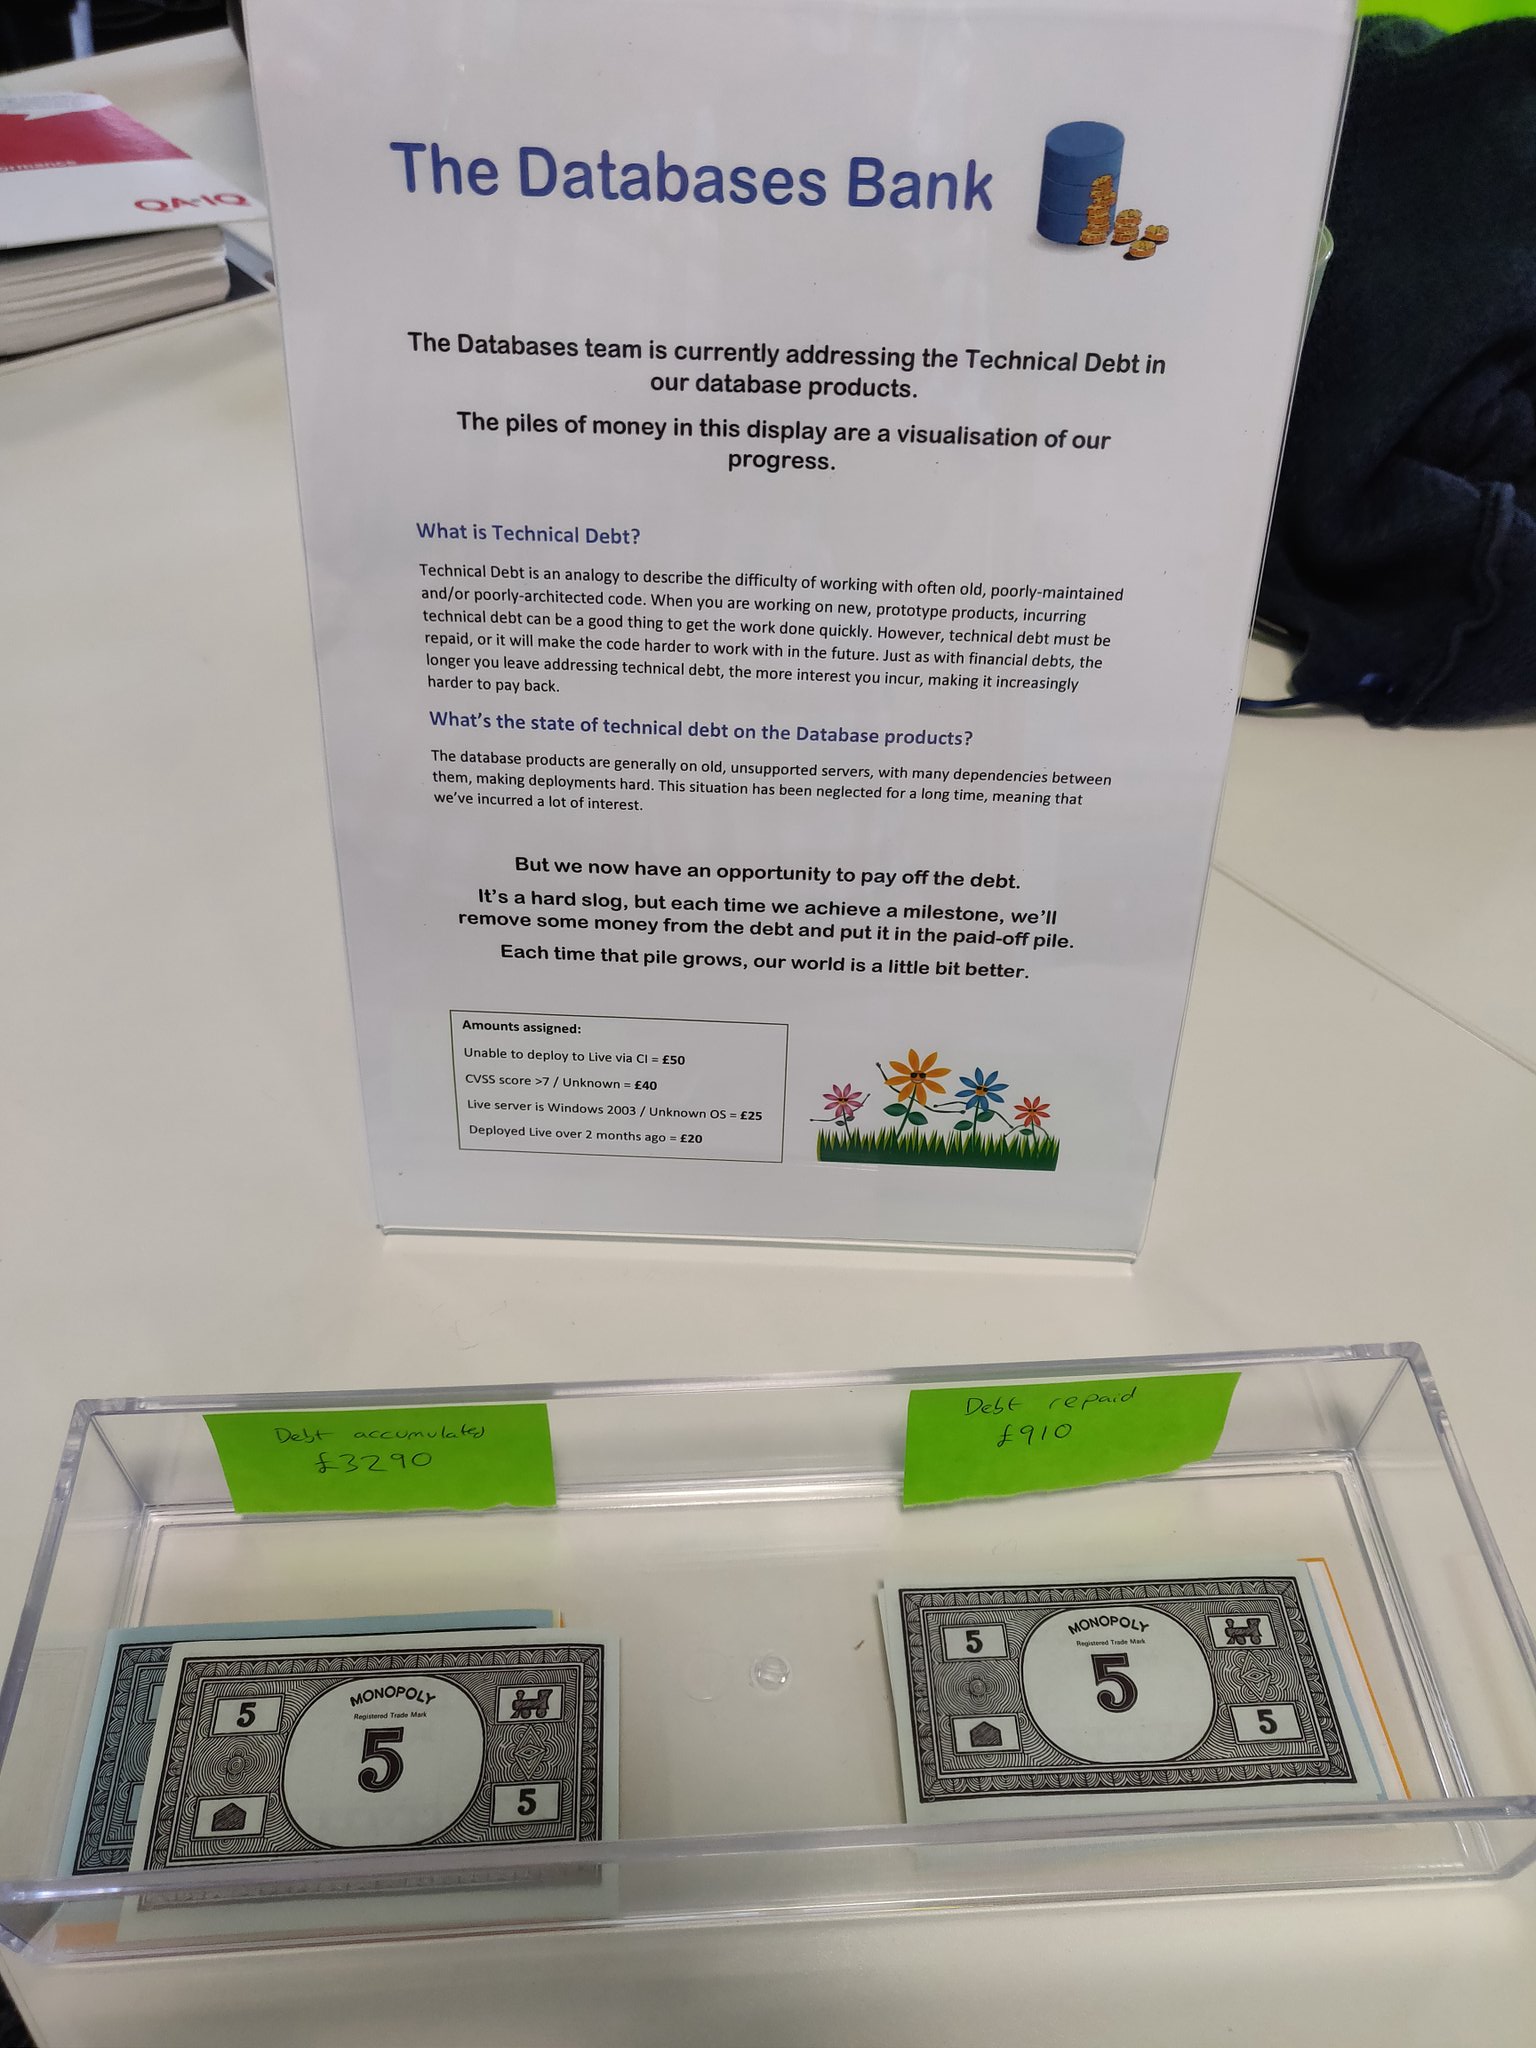
It was time for a creative solution. Inspired by both the term ‘technical debt’ and the product management prioritisation technique of asking stakeholders to vote on backlog items with money, I sat down with the team and we discussed which of the goals were ‘worth’ more, and put some values on them. We also took the opportunity to hold ourselves to account by putting a bit more rigour around the goals, for example, when we said ‘code must be deployable through our CI pipeline’ we specified ‘to live’, since deploying to UAT only might make the situation worse. Similarly, to measure ‘deployable at any time’, we specified that there must always have been a live deployment within the last two months. If no development work had happened for the previous eight weeks, deploying an unchanged build would be fine, but at least demonstrates that rot hasn’t started to set in. It’s the little failures nobody notices while they have other priorities that tend to add up to debt later.
The result was our new list of problems and their debt value:
- Websites running on unsupported operating systems = £25
- Websites that couldn’t be deployed all the way to live via the CI pipeline = £50
- Websites not deployed in the last two months = £20
- Websites with a CVSS score that was 7+ or which was unknown = £40
This allowed us to take the list of products that we did know about and calculate our starting level of debt: £3535! This approach also meant that, as we uncovered new information (whether good or bad), we could show this by adjusting the debt amount. In fact, five weeks after starting, our ‘debt’ figure had worsened to £4015, as the team had learnt more.
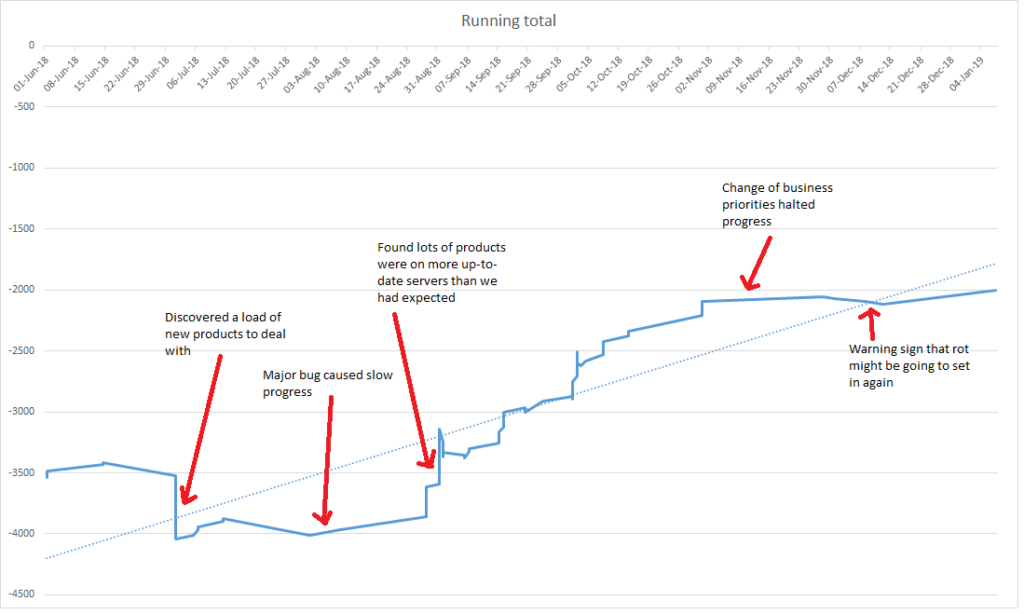
But above all, it meant that we could show our progress graphically and set up a celebration point for the team whenever we had removed £1000 from the debt.
To get a bit more momentum around this idea, I also acquired a load of Monopoly money and displayed it in the office, so colleagues could see money moving between a ‘debt’ and ‘repaid’ pile whenever something was ticked off the list.
This visualisation had a mixed response in the team. In all honesty, most developers were ambivalent about it, even if managers mainly liked it. It also had the slightly unforeseen difficulty in not being a great demonstration of continuous progress: The inter-dependencies tended to mean that the graph would go several weeks without many changes and then a big improvement as many products got deployed together. I’m not convinced that I ever managed to fully explain that that wasn’t a problem. If you try this in a similar context, I’d certainly recommend stressing that it shows repayment of whole pieces of debt, not progress through the work itself.
By the way, ‘repaying’ the debt wasn’t only a development job on this team. It was also a product management job as we managed to decommission a number of rarely- used websites. In those cases, we repaid all the debt on those products at the moment of decommissioning.
Recently, there has been an unexpected result of the graph. Remember that rule that everything should have been deployed in the last two months? In November and December, priorities changed, and the technical debt reduction work was paused (or rather, deprioritised) for a while. Due to this, and the fact regular deployments hadn’t been set up, the graph is now starting to head in the wrong direction, as deployments made in October start hitting the two month limit. This has served as a useful reminder that there’s still work to do if we aren’t going to have more problems in the future.
Are we aiming to repay the amount of debt all the way to zero? No, probably not. There wouldn’t be sufficient value in doing this. But monitoring this figure in the future should be a good mechanism to track where we are, and to ensure that the products are not allowed to become bad again, after all the investment we made during the latter half of 2018.


